
Maps to Explore from Your Desk
The maps to explore are:
- William Price’s 1769 update of John Bonner’s 1722 map of the town, showing just the Shawmut peninsula. (I have a print of this on my wall.)
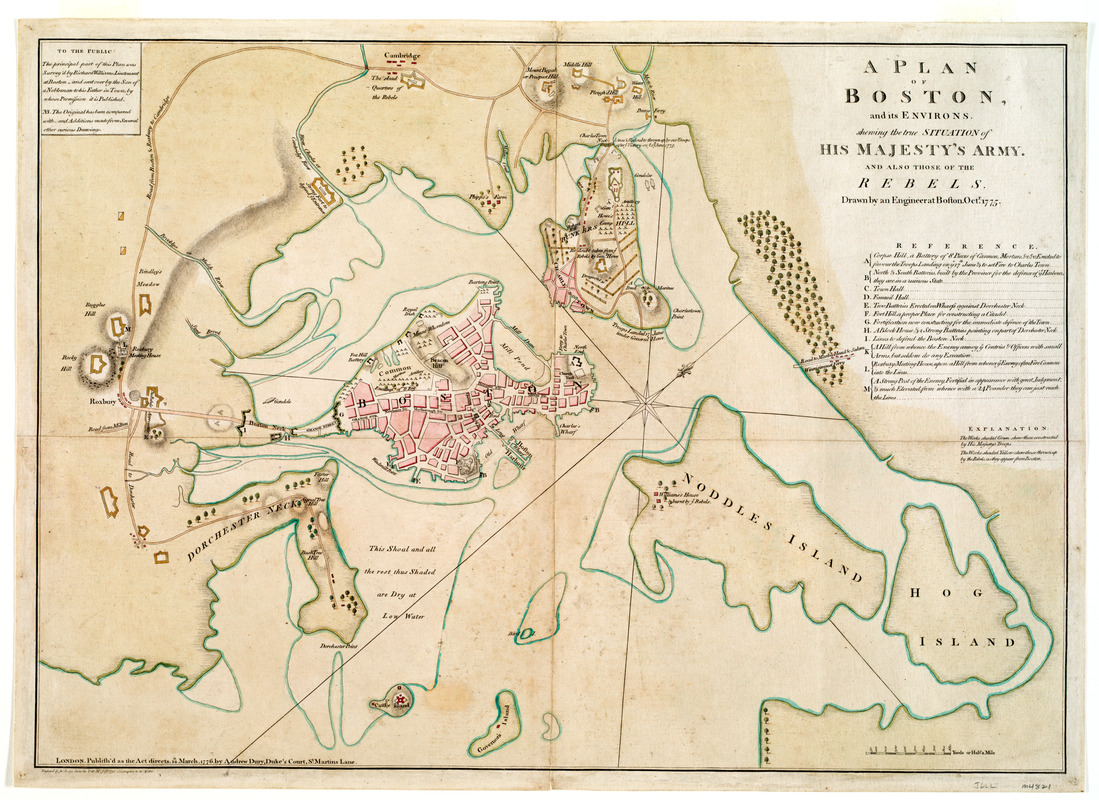
- Lt. Richard Williams’s map of wartime Boston, the provincial siege lines, and the inner harbor.
- London publishers Robert Sayer and John Bennett’s “Seat of War, in New England” map of eastern Massachusetts, featuring a little train of figures escorting Gen. George Washington toward Boston.
- Boston native Isaac de Costa’s map of eastern Massachusetts showing locations from the Battle of Lexington and Concord, including provincial cannon in the countryside.
I noted that the overview starts, “Colonial Boston was a flourishing city of 20,000 by the 1760s.” In fact, the 1765 census found 15,520 people in Boston. The surrounding towns, now incorporated into the city, added more people to the area, as did the short-term population of sailors and (at times) soldiers. But this essay makes clear that it counts those soldiers as separate from the town inhabitants.
That census figure is significant not just because of accuracy but also because it hadn’t changed much in decades. Boston was stuck at about 16,000 people while Philadelphia and New York grew larger. What once was Britain’s biggest and busiest port in North America became number three. A frustrating stagnation might have been one reason Bostonians were so easily worked up about imperial taxes in the 1760s.
Before leaving the Leventhal Center, I want to highlight another digitized item from the same decade: This map of the travels of the Qianlong Emperor of China in the fall of 1778.
As an object, this diagram of the imperial route unfolds into an image nearly twenty feet long. (It’s appropriate, therefore, that the interactive feature demands a screen of a certain size before it will show you anything.) The digital presentation comes with helpful explanations by Prof. Anne-Sophie Pratte.
No comments:
Post a Comment